How are you measuring your affiliate channel’s performance? This question has come up quite a bit over the last week as our team shares with each other and our clients’ experience some amazing growth numbers. Black Friday and Cyber Monday YoY comparisons have been shouted across the office and on Slack with excitement! 300% growth, 35% New to File, and many other wins are definitely exciting to share. And share we do!
Most commonly you are probably looking at top line sales. “Our affiliate program brought in $1M this month! Achievement Unlocked!” It can definitely make you feel the extremes of either joy or pain – depending on where you expected to be. But, to be quite honest and blunt with you, that single number – top line sales – holds so little value it is truly remarkable. This is especially true when you see no growth or even a decline in revenue. Is that always a failure? That’s what I’d like to share with you today. It’s a real world example that shows that top line number isn’t the whole story.
So, where are we, what is this real world example? A recently new client of ours just got through their first Black Friday and Cyber Monday under the management of JEBCommerce. On the top line, they realized a 3% increase in sales. Growth yes, but not the type of growth we aim for, especially when the majority of our retail clients are seeing 40-300% growth YoY. 3% is pretty much break even.
So, hey at least we didn’t go backwards right? That’s the story from the top line revenue. But this couldn’t be farther from the truth. To get to the real story, you have to look at what brick and mortar retailers call Same Store Sales. It’s a pretty simple concept – you measure the aggregate, but you also look at growth YoY by individual store, or in this case, individual affiliate.
So let’s look at this example…what truly happened here? In order to figure that out, you have to compare last year’s data with this year’s data. So let’s look at the affiliates that performed in both time periods:
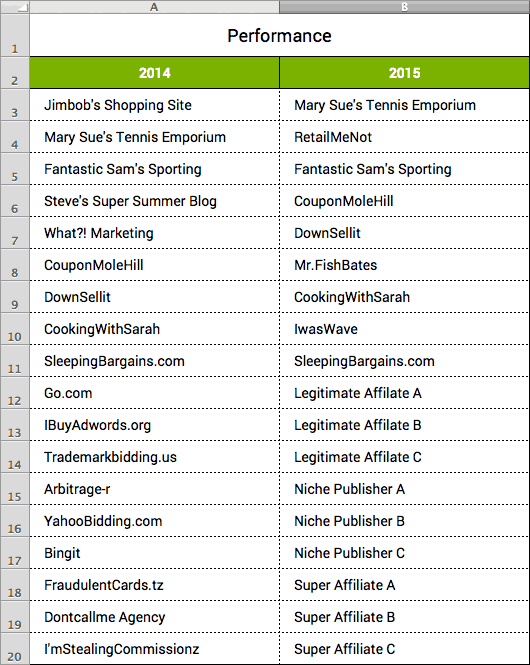
What do you see (other than my humor and seeing it run out)? Huge affiliate partner turn over…right? Imagine if each affiliate in both years had an even distribution of sales. When we look at “same store sales”, or “same partner sales”, we see that we removed 63% of the affiliates and requisite sales, for some reason or another in the year 2015. Then we see we added almost 100% of new affiliates into the program.
So, we lost 9 affiliates in 2015 and we added 11 back. Why? You have to keep digging, maybe you see where I’m going by the names of the affiliates we lost. You see, when we took the program over, we saw that those 9 affiliates were doing one of the following three things:
- Bidding on trademarks that they were not allowed to
- Sending fraudulent sales
- Overwriting cookies and thus stealing commissions
So we removed them – even though that removed 63% of sales. So there we were, a month out of Q4 and already down 63% from last year, let alone realizing any growth. Then look at 2015. You see 9 new partners that generated the requisite income. But real revenue, not fraudulent, trademark bidding, and no existent sales. So, in reality you have to re-adjust 2014 numbers so you are looking at same partner sales. Let’s use $1,000,000 as the example.
Each affiliate in 2014 generated about $55,000. So, 2014 in reality only generated $555,000 of real, recognized revenue. But in 2015, all the affiliates, all legitimate, generated over $1,000,000. That is almost a 100% increase in revenue year over year. Now that is a compelling story.
You see, the data tells a story. And one line item, top line revenue, doesn’t represent the whole picture. Yes, sales grew by 3%, but they really grew by 100% when you look at same partner sales. That tells a more accurate story. Now go and be profitable! Hope this helps.
What ways have you found to measure your channel’s success?